Visualize Spark Performance Like Never Before
Better Spark UI transforms how you debug and optimize Apache Spark applications with intuitive visualizations and powerful insights.
Everything you need to optimize Spark performance
Better Spark UI provides powerful visualizations and insights to help you identify and fix performance bottlenecks in your Spark applications.
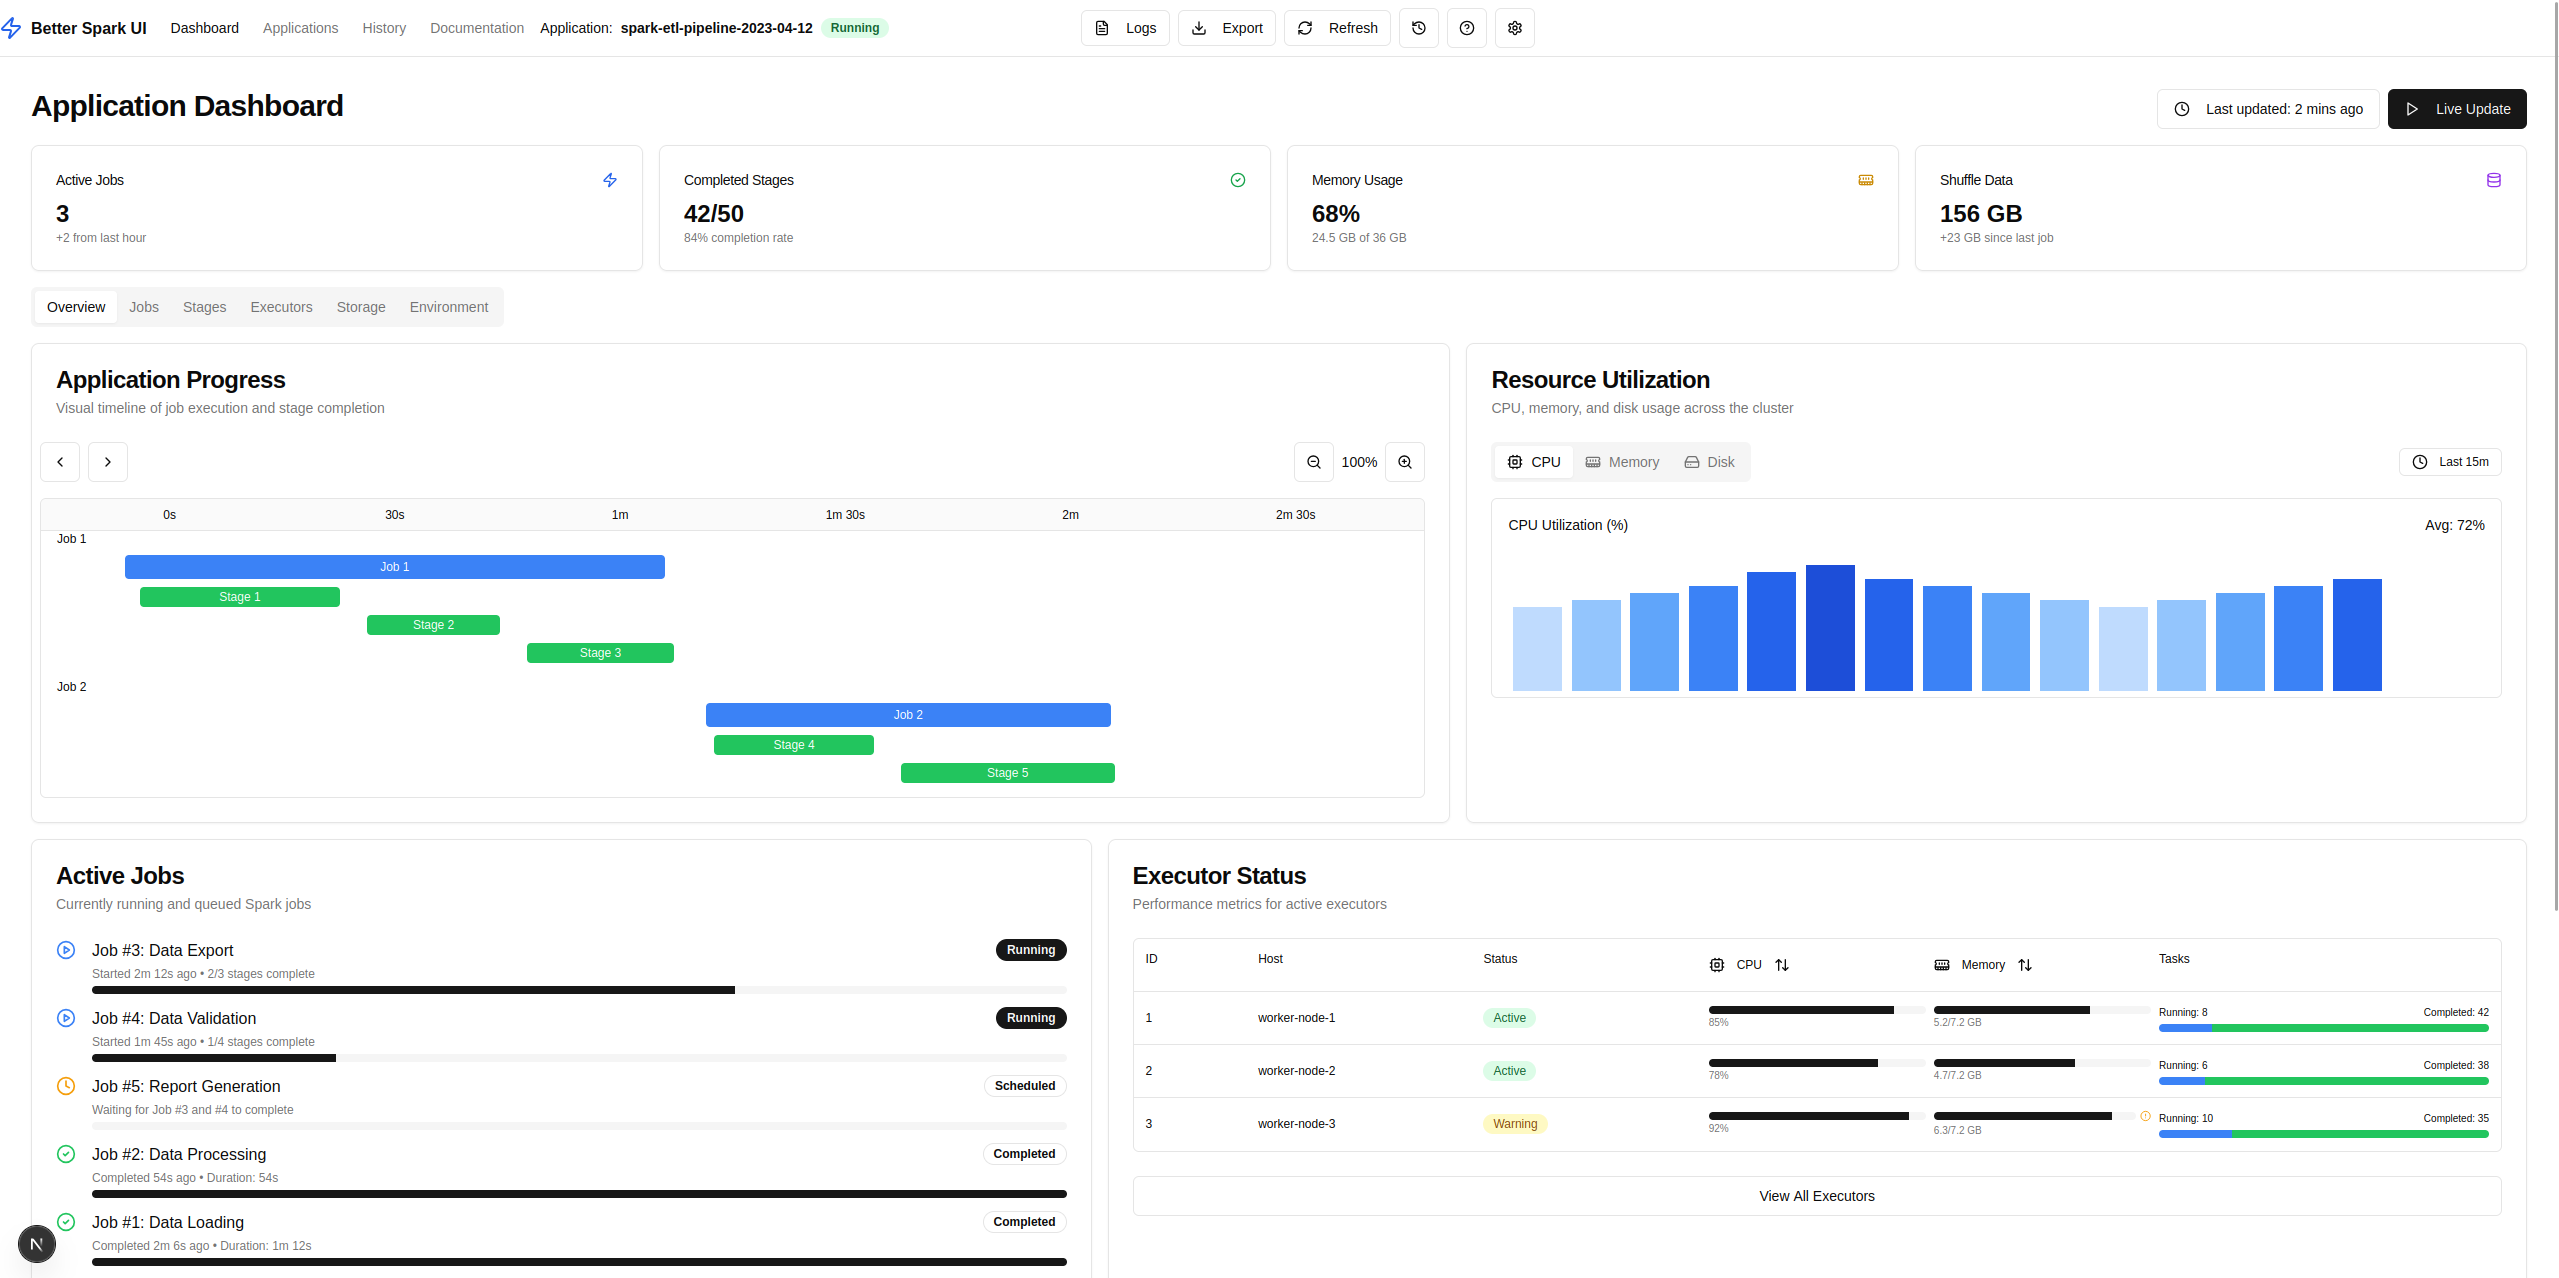
Interactive visualization of job execution and stage completion, making it easy to identify bottlenecks and optimize performance.
Real-time graphs of CPU, memory, and disk usage across your cluster, helping you identify resource constraints.
Proactive identification of potential issues like GC overhead, data skew, and slow shuffle operations.
Detailed insights into Spark SQL query performance, including execution plans and optimization recommendations.
Visualize memory usage patterns and get recommendations for optimal memory configuration to prevent OOM errors.
Actionable recommendations to improve application performance, based on best practices and analysis of your workloads.
Boost developer productivity and application performance
Our intuitive interface helps your team identify and fix performance issues faster, reducing development time and infrastructure costs.
Reduce debugging time by 60%
Quickly identify the root cause of performance issues with visual timelines and alerts.
Cut infrastructure costs by 30%
Optimize resource utilization with detailed insights into CPU, memory, and disk usage.
Improve job completion times
Get actionable recommendations to optimize your Spark applications for faster execution.
Simplify onboarding
Intuitive interface helps new team members understand Spark application behavior faster.
See Better Spark UI in action
Explore our powerful features designed to help you understand and optimize your Spark applications.
The Visual Timeline provides a comprehensive view of your Spark application's execution flow, making it easy to identify bottlenecks and optimize performance.
Timeline Visualization
Key Features
- Interactive zooming and panning
- Detailed tooltips with stage metrics
- Color-coded status indicators
- Hierarchical job and stage visualization
Benefits
- Quickly identify execution bottlenecks
- Understand stage dependencies
- Track job progress in real-time
- Compare execution times across stages
Be the first to experience Better Spark UI
Join our waitlist to get early access and exclusive updates on our launch.
We'll never share your information with third parties.